Overview
A widely-cited case report describes how combining Panoramic Power wireless current-sensor data with Tableau business-intelligence dashboards delivered more than $300,000 in measurable annual savings for several major brands. The story is a useful example of how granular IoT energy data, surfaced through a familiar analytics tool, can outperform traditional energy-management software.
The setup
Panoramic Power sensors are self-powered, snap-on current transformers that report circuit-level electricity data wirelessly at one-minute intervals. The deployments described in the report covered hundreds of circuits across retail, hospitality, and light-industrial facilities — typically targeting HVAC equipment, refrigeration, lighting panels, and key process loads.
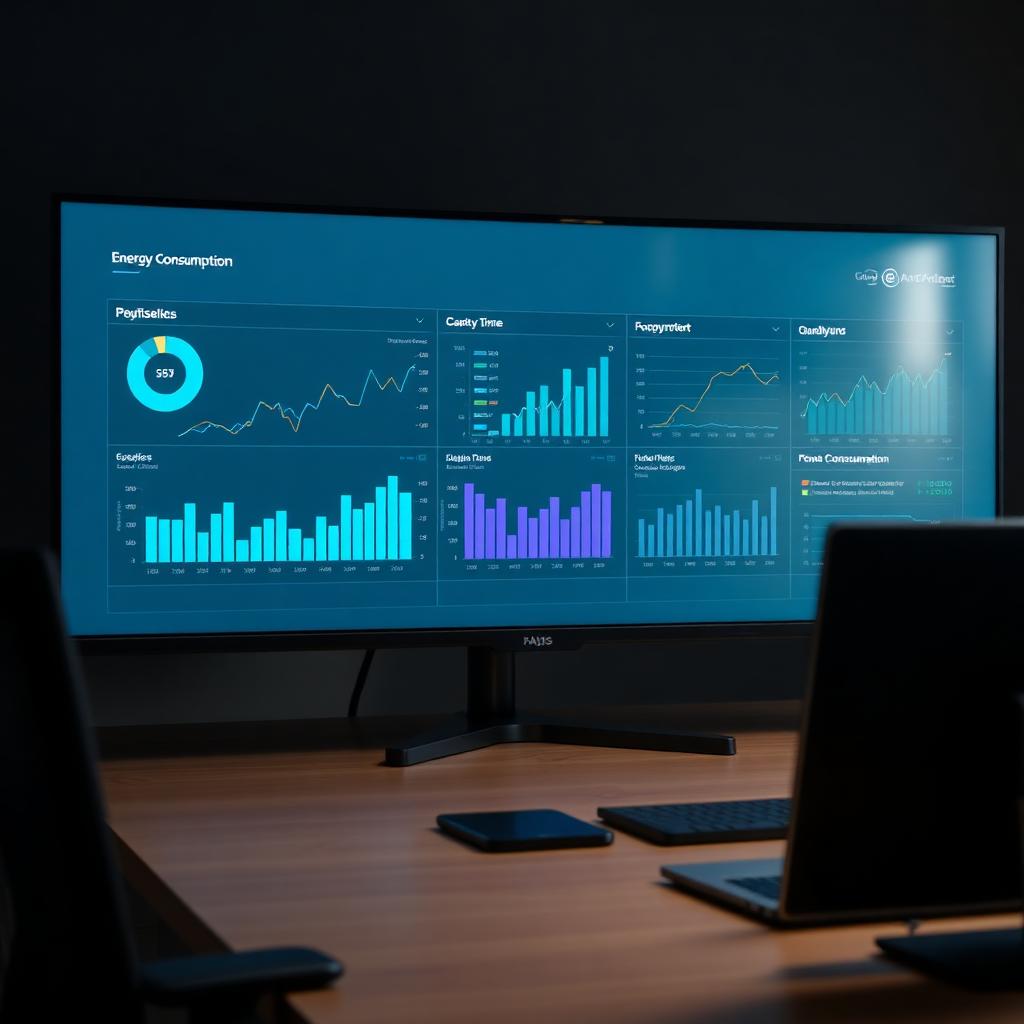
Rather than relying on the vendor's native dashboards alone, the teams piped the sensor data into Tableau, where analysts and operators built custom views aligned to how each business actually made decisions: by store, by region, by equipment class, by shift.
What the data revealed
With high-resolution circuit data flowing into Tableau, the teams quickly identified patterns invisible at the utility-bill level:
- After-hours loads running on schedules that hadn't been updated in years
- Refrigeration compressors short-cycling due to failing controls, driving both energy waste and equipment wear
- HVAC simultaneous heating and cooling in shoulder seasons
- Lighting circuits energized 24/7 in spaces with motion-sensor occupancy
- Anomalous baseline draws that flagged failing equipment weeks before it broke
Each anomaly was a small line item, but at portfolio scale they aggregated quickly. The combined savings across the documented sites exceeded $300,000 per year — a figure that paid back the entire sensor and BI deployment in well under twelve months.
Why the combination worked
The case study's lesson isn't really about Panoramic Power or Tableau specifically. It's about the pairing:
- Granular, always-on metering at the equipment level provides the raw data needed to detect small, recurring waste.
- A flexible BI layer lets non-engineers slice that data the way their business runs, rather than the way the energy software was designed.
Traditional energy-management platforms often force users into pre-built dashboards. Pushing the same data into Tableau (or Power BI, Looker, or similar) lets operations, finance, and sustainability teams ask their own questions — and act on the answers without filing IT tickets.
Takeaway
For multi-site operators, the combination of low-cost wireless submetering and a general-purpose analytics layer is a proven, repeatable model. The technology stack is mature, the install footprint is minimal, and — as this case report shows — the savings are measurable in real dollars.