

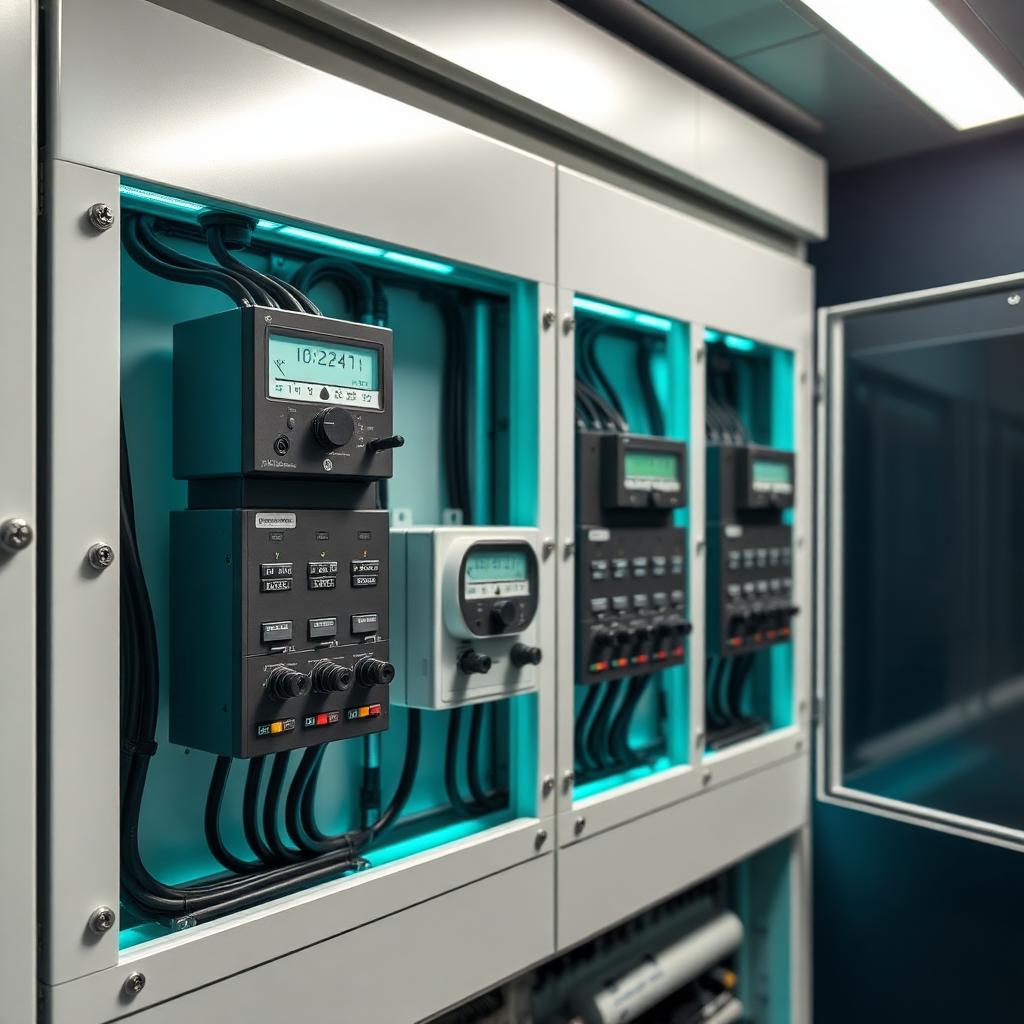
Most commercial and industrial facilities pay one utility bill. That bill tells you exactly how much energy you consumed last month and what you owe. What it doesn't tell you is which systems, circuits, or operating patterns are responsible for that number, and that gap is where money disappears every single month without anyone noticing. Submetering closes that gap by installing secondary meters downstream of your master meter to capture consumption at the circuit, panel, tenant, or equipment level, turning an opaque utility bill into a transparent, actionable dataset.
The master meter at your building's service entrance was designed for billing, not diagnosis. It aggregates every load across every circuit into a single kilowatt-hour total. For a facility running HVAC, compressed air, process equipment, lighting, and office systems simultaneously, that number is operationally useless. You can't manage what you can't measure at the right level of detail. Emergent Energy Solutions was built specifically around closing this gap, using circuit-level metered data and engineer-led analysis to convert an opaque utility bill into a transparent, actionable picture of exactly where energy dollars are going.
Here's how submetering works, what it reveals, and why the return on investment ranks among the strongest of any capital program available to commercial and industrial facility operators today.
What submetering is and why your utility meter falls short
The utility-installed master meter at your service entrance performs one function: it measures total consumption for billing purposes. Every load across every circuit in your facility collapses into a single aggregated number. For a 200,000-square-foot manufacturing plant or a multi-tenant office building, that number is essentially a financial statement with no line items. It tells you the total cost but nothing about the source.
A submetering system adds a second layer of measurement downstream of the master meter. Secondary meters are installed at the panel, circuit, tenant space, or individual equipment level, giving operators granular consumption data the utility meter was never designed to provide. There are two primary categories to understand: revenue-grade submeters (meeting ANSI C12.20 accuracy standards, required for tenant billing and submeter billing applications) and monitoring-grade submeters (used for operational analysis and waste identification). For most commercial and industrial facilities, electricity is the right starting point because that's where the largest cost exposure sits, though water, gas, and thermal energy submetering follow the same core principle.
The practical difference this creates is significant. That same 200,000-square-foot manufacturing facility with a $40,000 monthly electric bill suddenly becomes readable. With circuit-level metering on HVAC systems, compressed air compressors, lighting panels, and process lines running separately, you can see that 34% of consumption is happening between midnight and 6 AM when production is idle. That single data point changes the entire conversation about where to start cutting costs.
What circuit-level data actually reveals in commercial and industrial facilities
Circuit-level data consistently surfaces the same categories of waste across commercial and industrial properties. HVAC systems running full schedules on unoccupied weekends. Refrigeration units cycling during peak demand windows, driving up demand charges for the entire billing period. Compressed air compressors left running through shift changes. Lighting systems on circuits that were never connected to occupancy controls. These aren't edge cases; they're the recurring findings when granular measurement is applied to a building that was previously billed as a single load.
For C&I facilities, demand charges deserve particular attention. Utilities bill commercial and industrial customers not just for total kilowatt-hours consumed, but for the highest 15-minute peak demand window in the billing period. One piece of equipment starting at the wrong time can set the demand peak for the entire month, and for many facilities, demand charges represent 30 to 50% of the total electric bill. Without circuit-level data, you can't identify which load is responsible. With it, you can see the exact circuit, the exact timestamp, and the exact contribution to the peak, the prerequisite for every load management strategy that follows.
There's a third category of value that's frequently overlooked: equipment health signals embedded in consumption data. A chiller drawing 15% more current than its baseline for three consecutive days is communicating something important. A compressed air system with a slow overnight leak shows up as consumption that never drops to zero when the facility is unoccupied. These signals are invisible on a master meter and clearly visible on an energy submeter, turning consumption data into a maintenance intelligence tool that reduces both energy spend and unplanned downtime simultaneously.
The specific mechanisms that reduce your energy bill
When you can see consumption at the circuit level, waste stops being a vague category and becomes a specific, addressable line item. The data-to-action chain is direct: submetering identifies the source, engineering analysis confirms the cause, and operational or equipment changes eliminate it. Correcting HVAC scheduling mismatches, fixing compressed air leaks, eliminating phantom loads on idle equipment, and right-sizing process machinery are all decisions that require circuit-level data to execute with precision. Without it, you're guessing.
Electric submetering ROI: demand charge reduction
Facilities that apply electric submetering to demand charge management consistently achieve 10 to 20% reductions in the first year, with many industrial operations reaching 15 to 25% once load scheduling changes are fully implemented. According to ACEEE benchmarking data and utility demand response program records, the mechanism follows a clear sequence: stagger equipment startups to flatten the demand curve, identify and trim peak demand events before they set the monthly billing peak, and qualify for utility demand response programs that pay facilities to curtail load during grid stress. None of these strategies are executable without knowing which circuits are responsible for peak demand in real time.
For multi-tenant commercial buildings, accurate cost allocation through tenant metering is its own financial argument. Properties using square-footage-based utility allocation (RUBS) consistently under-recover utility costs, typically by 10 to 25%, because the formula doesn't reflect actual usage behavior. Apartment submeters and commercial tenant meters replace estimates with measured consumption per space, recovering costs that were previously absorbed by the owner. For industrial facilities running multiple production lines or cost centers, the same principle applies: actual measured consumption per line gives operations teams accurate cost-of-production data that feeds directly into pricing, budgeting, and process optimization decisions.
What the return on investment actually looks like
Electric submetering in commercial and industrial settings often pays back within the first few years, driven by a combination of consumption reduction and utility cost recovery through accurate billing. Water submetering generally takes longer to pay back, depending on installation complexity and local water rates. The consumption reductions that drive these returns come from operators gaining visibility into their own data and acting on it; the size of the reduction depends on the facility's starting point, load mix, and how aggressively the findings are pursued. For facilities moving from no circuit-level metering at all, the first year of data almost always reveals more savings opportunity than the installation cost of the metering system itself.
Payback scenarios by facility type
The mechanism behind consumption reduction is both operational and behavioral. When facility managers, operations directors, and shift supervisors can see their own consumption data in near real time, decisions change. Equipment gets shut down properly at shift end. HVAC setpoints get adjusted on unoccupied days. Compressed air systems get leak audits because the data shows the ROI is there. This behavioral accountability is a primary driver of sustained reductions documented across submetered properties. Data creates accountability. Accountability changes behavior in measurable, sustained ways.
The long-term math is compelling. Because submeter hardware lasts 10 or more years, the net benefit compounds well beyond the initial payback period — the savings recur annually while the capital cost is incurred once. For industrial facilities where demand charges can represent tens of thousands of dollars per month, even a modest reduction in peak demand alone can deliver meaningful annual savings, depending on facility size and rate structure.
How Emergent Energy Solutions turns submetering data into measurable savings
Installing submeters generates data. Raw data sitting in a dashboard doesn't reduce anyone's energy bill. The engineering analysis layer is what converts consumption readings into identified waste, quantified savings opportunity, and a prioritized action plan with measurable outcomes. This is the distinction between a monitoring project and a savings program, and it's a distinction that matters significantly for the actual results you achieve.
Emergent Energy Solutions provides both the submetering infrastructure and the engineer-led analysis that makes the data actionable. The process connects every component: circuit-level data is collected across the facility portfolio, engineers analyze consumption patterns against operational schedules and rate structures, demand charge exposure is mapped and prioritized, utility rebate opportunities are identified and filed, and resulting savings are tracked against a documented measurement and verification baseline. This integrated approach makes savings claims auditable rather than estimated, a meaningful difference when you're reporting to investors, corporate leadership, or regulatory bodies.
The downstream value of accurate, continuous submeter data extends well beyond operational savings. It supports defensible Scope 1 and Scope 2 carbon reporting for ESG and investor requirements, provides the measurement and verification foundation that utility rebate programs require, and documents compliance with building performance standards that are increasingly enforceable across Mid-Atlantic states. Emergent Energy Solutions' specific expertise in PA Tier II RECs, PJM market dynamics, and regional building performance standards means the data captured through submetering feeds directly into incentive recovery and compliance outcomes, not just operational savings that benefit one budget line while leaving others untouched.
What to get right before installing a single meter
Meter selection should start with one question: what decisions do I need this data to drive? For panel and circuit-level monitoring, CT-based electric submeters are the standard approach. Wireless AMI systems using RF mesh or cellular communication eliminate the need for wired data collection infrastructure, making them practical for larger or more complex facilities. PLC-based systems work well in dense urban environments where RF signal penetration is limited. The right technology depends on facility size, electrical architecture, data granularity requirements, and whether the data will be used for internal operational analysis or revenue-grade tenant billing, each of which carries different accuracy and documentation requirements.
The regulatory landscape adds another layer of planning worth understanding before installation begins rather than after. At the federal level, ASHRAE 90.1 and IECC energy codes increasingly require submetering for large commercial tenant spaces in new construction and major renovations. In New Jersey specifically, tenant spaces exceeding 10,000 square feet must be individually submetered under ASHRAE 90.1-2019, with data captured at 15-minute intervals and retained for 36 months. Maryland and Pennsylvania operate differently: their building performance standards focus on whole-building owner reporting rather than tenant-specific mandates, though submetered data plays a practical role in excluding specific energy uses from benchmarking calculations. State utility commissions also regulate how submeter data can be used for tenant billing and what accuracy standards meters must meet. Disclosure requirements vary by jurisdiction, so confirming applicable rules before installation prevents costly retrofits and billing disputes down the road.
The utility bill is a lagging indicator, not a tool
Every month that passes without circuit-level measurement is a month where the waste is still running, the demand peaks are still happening, and the rebate opportunities are sitting unclaimed. The utility bill tells you the damage after the fact. Submetering tells you where it's coming from in time to do something about it.
The savings are real, well-documented, and achievable across both commercial and industrial applications. But hardware alone doesn't deliver them. The results come from connecting metered data to engineering analysis to operational action, a sequence that requires expertise, not just equipment. For facilities and portfolios that want a managed energy reduction program rather than a monitoring system, Emergent Energy Solutions delivers exactly that integration: submetering, rebate capture, compliance, and procurement tied together under one accountable program.
If your facility is still paying a single utility bill with no visibility into what's driving it, the first step is understanding what circuit-level data would actually reveal. Contact Emergent Energy Solutions to schedule a free submetering assessment and see what your energy data has been trying to tell you.